In my previous post I explained how oVirt managed VMs can be integrated with Prometheus by exposing VDSM metrics with vdsm-prometheus.
If relying on VDSM this is a very nice way to integrate your datacenter with Prometheus. However while VDSM is a very sophisticated host agent regarding managing VMs it is not that easy to communicate with it. VDSM uses asynchronous communication based on STOMP with JSON-RPC inside. So even asking VDSM simple things like VM statistics, VM health or VM specifications means that you need a STOMP client and properly constructed JSON requests. Further if you are not using oVirt, most likely you are not using VDSM.
This is where vAdvisor can help out. It is a lightweight python application which purely focuses on easy access for read-only operations by directly querying libvirt.
The highlights are:
- Metrics exposed for Prometheus
- StatsD export (for integration with StatsD, Hawkular and others)
- REST based access to metrics
- REST based access to VM specifications
- VM lifecycle event stream via long polling
- Historical VM lifecycle events
Getting started
An easy way to get started is to use the docker image virtkube/vAdvisor:
docker run \
    --volume=/var/run/libvirt/libvirt-sock-ro:/var/run/libvirt/libvirt-sock-ro:Z \
    --name vadvisor \
    --publish 8181:8181 \
    --detach=true \
    --privileged \
    virtkube/vadvisor:latest
This will start vAdvisor in the background on port 8181. Note that passing in the libvirt socket is enough to allow it to communicat with libvirt. Since vAdvisor only does read-only operations, no credentials are necessary.
Metrics
To actively poll for metrics two endpoints can be used. The first is the
/metrics endpoint which exposes all VM statistics in the text based
Prometheus data format:
curl http://localhost:8181/metricsThe second one is the /api/v1.0/stats/ endpoint. It reports all metrics in a
JSON format pretty similar to cAdvisor.
curl http://localhost:8181/api/v1.0/stats/Events
To listen for VM lifecycle events a simple HTTP call is enough.
curl -N 'http://localhost:8181/api/v1.0/events?stream=true&all_events=true'{"domain_id": "c27c2656-f273-4fa8-9517-c3ee6437addd", "event_type": "Started", "domain_name": "vm3", "timestamp": "2016-06-14T13:25:57.002869Z", "reason": "Booted"}
{"domain_id": "c27c2656-f273-4fa8-9517-c3ee6437addd", "event_type": "Suspended", "domain_name": "vm3", "timestamp": "2016-06-14T13:26:03.733090Z", "reason": "Paused"}
{"domain_id": "c27c2656-f273-4fa8-9517-c3ee6437addd", "event_type": "Resumed", "domain_name": "vm3", "timestamp": "2016-06-14T13:26:07.323425Z", "reason": "Unpaused"}
{"domain_id": "c27c2656-f273-4fa8-9517-c3ee6437addd", "event_type": "Stopped", "domain_name": "vm3", "timestamp": "2016-06-14T13:26:10.852294Z", "reason": "Destroyed"}One line corresponds to one event. The event_type field reveals that VM vm3
was Started, Suspended, Resumed and finally Stopped. Don’t forget to
specify the -N to curl. Without it curl will buffer received events and
you will not see much.
Querying for historical events is simple too:
curl -N 'http://localhost:8181/api/v1.0/events?start_time=2016-06-14T13:25:56Z&max_events=2&all_events=true'{"domain_id": "c27c2656-f273-4fa8-9517-c3ee6437addd", "event_type": "Started", "domain_name": "vm3", "timestamp": "2016-06-14T13:25:57.002869Z", "reason": "Booted"}
{"domain_id": "c27c2656-f273-4fa8-9517-c3ee6437addd", "event_type": "Suspended", "domain_name": "vm3", "timestamp": "2016-06-14T13:26:03.733090Z", "reason": "Paused"}Since a maximum of two results was requested, only the first two events were returned.
Watching migrating VMs
To demonstrate vAdvisors capabilities I migrated vm test1 from one host with
IP 192.168.122.41 to another host with IP 192.168.122.31 while listening to
the vAdvisor event streams on each server. Further Prometheus monitored the
vAdvisor instances too .
Here are the events I received from 192.168.122.31:
curl -N 'http://192.168.122.31:8181/api/v1.0/events?stream=true&all_events=true'{"domain_name": "test1", "timestamp": "2016-06-14T16:36:18.367296Z", "domain_id": "023e5b8a-f822-4f50-b51f-bec51e5044b2", "reason": "Migrated", "event_type": "Started"}
{"domain_name": "test1", "timestamp": "2016-06-14T16:36:18.589595Z", "domain_id": "023e5b8a-f822-4f50-b51f-bec51e5044b2", "reason": "Unpaused", "event_type": "Resumed"}
{"domain_name": "test1", "timestamp": "2016-06-14T16:36:18.592874Z", "domain_id": "023e5b8a-f822-4f50-b51f-bec51e5044b2", "reason": "Migrated", "event_type": "Resumed"}As expected the VM was migrated to this host and started. On host
192.168.122.41 vAdvisor sent the notification that the VM was migrated and
stopped:
curl -N 'http://192.168.122.41:8181/api/v1.0/events?stream=true&all_events=true'{"domain_name": "test1", "domain_id": "023e5b8a-f822-4f50-b51f-bec51e5044b2", "event_type": "Suspended", "timestamp": "2016-06-14T16:36:18.668924Z", "reason": "Paused"}
{"domain_name": "test1", "domain_id": "023e5b8a-f822-4f50-b51f-bec51e5044b2", "event_type": "Stopped", "timestamp": "2016-06-14T16:36:19.625654Z", "reason": "Migrated"}The vm_up metrics in Prometheus reflect the migration too:
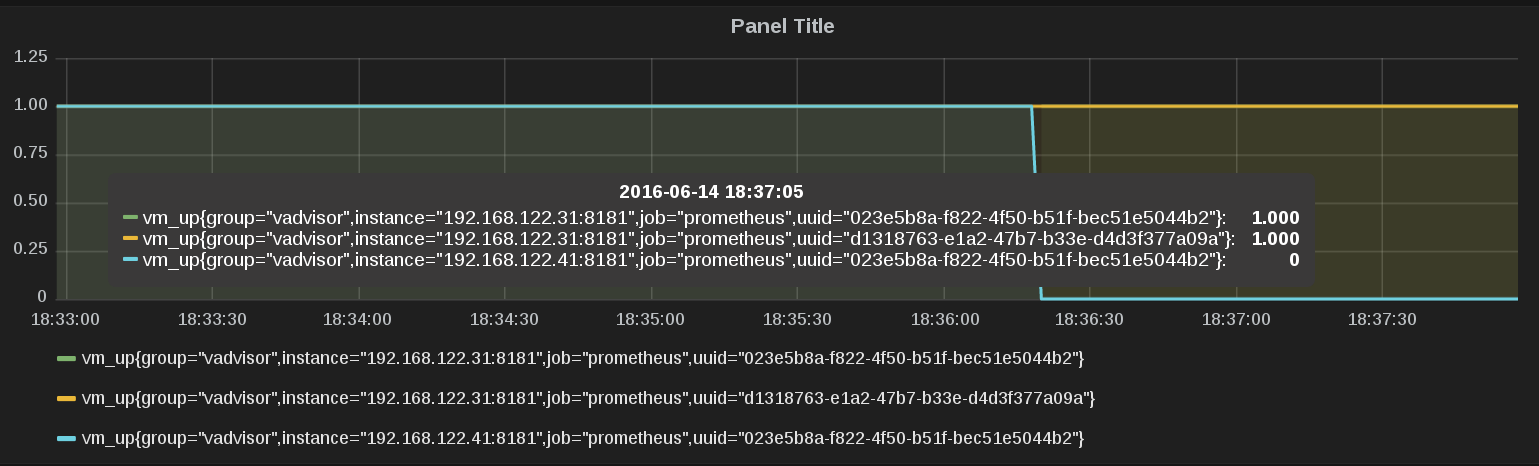
Note that the VM will be reported as down on the old host for another 10 minutes by vAdvisor. This is necessary because Prometheus would report the suddenlty disappeared metric for another 5 minutes with the last recored state.
What’s even better than visualizing this is that you can query Prometheus directly to implement your own VM monitoring rules:
curl --silent 'http://localhost:9090/api/v1/query?query=vm_up>0' | jq ""{
"status": "success",
"data": {
"resultType": "vector",
"result": [
{
"metric": {
"__name__": "vm_up",
"group": "vadvisor",
"instance": "192.168.122.31:8181",
"job": "prometheus",
"uuid": "023e5b8a-f822-4f50-b51f-bec51e5044b2"
},
"value": [
1465972160.935,
"1"
]
},
{
"metric": {
"__name__": "vm_up",
"group": "vadvisor",
"instance": "192.168.122.31:8181",
"job": "prometheus",
"uuid": "d1318763-e1a2-47b7-b33e-d4d3f377a09a"
},
"value": [
1465972160.935,
"1"
]
}
]
}
}Integrating with Hawkular
If Hawkular is your chosen metrics collector,
ptrans
from Hawkular can be used as StatsD proxy server. Just tell vAdvisor with the
--statsd-host parameter where ptrans is located. vAdvisor will then
periodically push all metrics to Hawkular.
Stay tuned for more about integrating vAdvisor with Hawkular and cAdvisor in my next post.