oVirt allows you to run and monitor thousands of VMs in your virtual datacenter. Combining it with Prometheus and Grafana gives us access to real time metrics and time series combined with a powerful query language and customized dashboards. The advantages are obvious: Finding hosts which are underutilized, finding VMs which are not behaving or even comparing resource usage profiles of whole cluster over days become easy tasks. Further we can use the Prometheus Alertmanager for alerting.
In the following lines we will setup all required services to monitor your virtual datacenter with Prometheus and Grafana. Note that all services can be secured with TLS and can use client certificates for authentication but for the sake of simplicity we will deploy the services without TLS.
Architecture
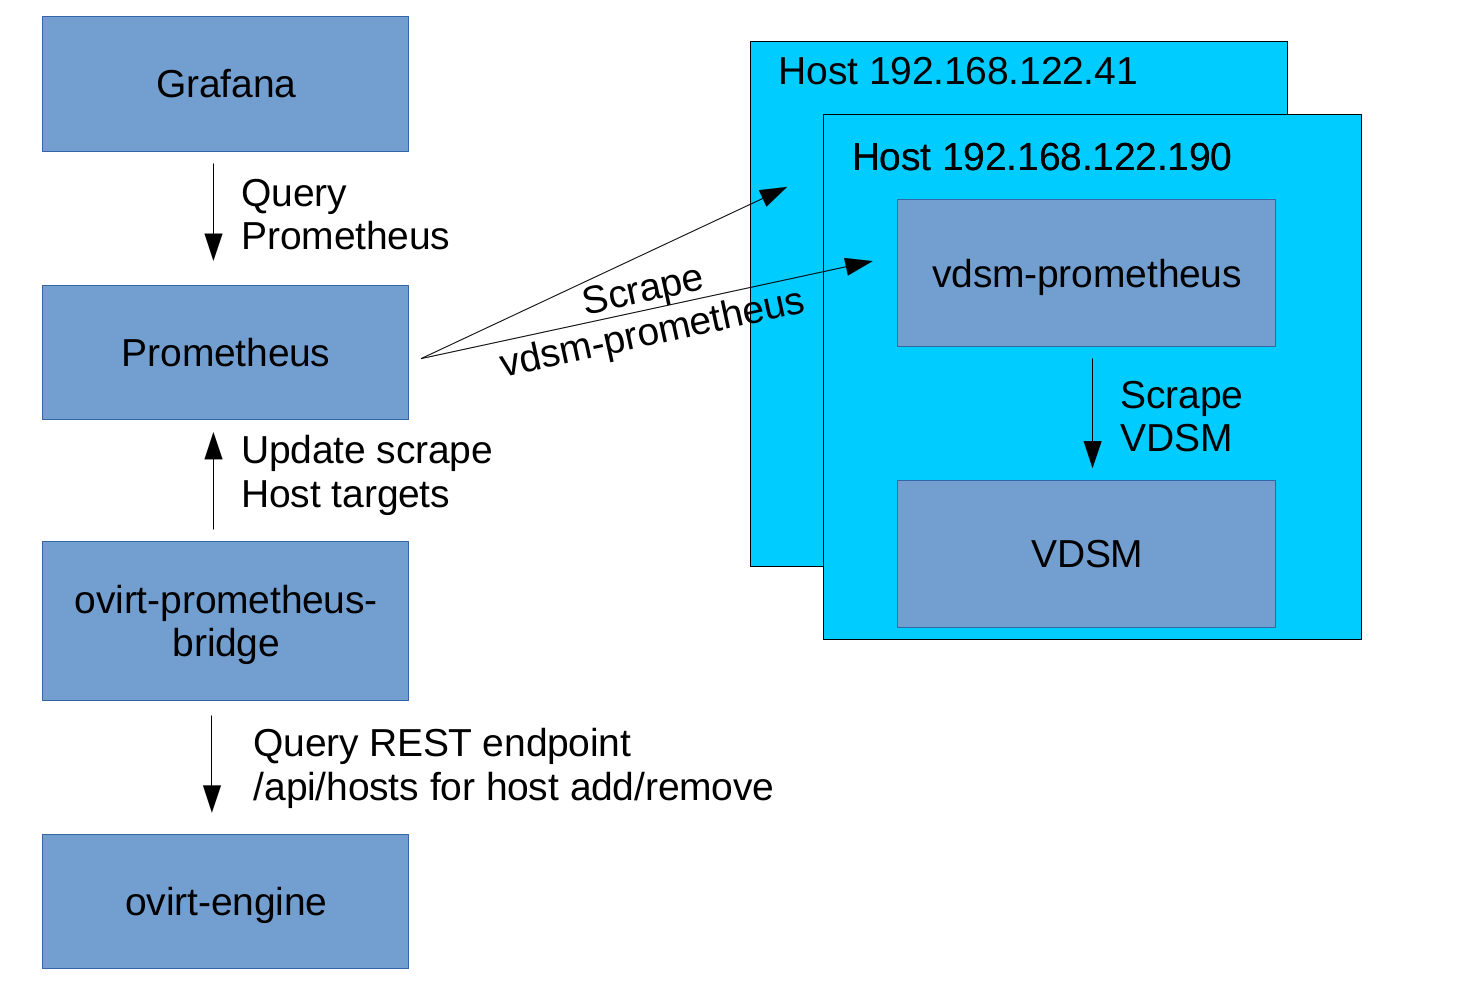
We need two small services ovirt-prometheus-bridge and vdsm-prometheus to close the gap between oVirt and Prometheus. ovirt-prometheus-bridge is repeatedly querying oVirt Engine to see if hosts were added or removed. When this happens it updates the Prometheus targets. Prometheus looks for the vdsm-prometheus service on every host and collects the metrics from there. Finally we can visualize the selected data in Grafana or directly query Prometheus through its REST-API. vdsm-prometheus is compatible to VDSM shipped with oVirt 3.5 and newer and can be rolled out to all hosts with the Ansible role rmohr.vdsm-prometheus.
Here you can see an overview of all involved components:
Prepare Prometheus, Grafana and ovirt-prometheus-bridge
Let’s run Prometheus and Grafana with automatic oVirt host discovery in docker:
git clone https://github.com/rmohr/ovirt-prometheus-bridge.git
cd ovirt-prometheus-bridge
export ENGINE_PASSWORD=engine
# oVIrt Engine IP (In my case the engine and my containers are running on the same host):
export ENGINE_HOST=`ip -4 addr show scope global dev docker0 | grep inet | awk '{print \$2}' | cut -d / -f 1`
docker-compose up
Add a Prometheus datasource to Grafana:
curl -X POST -H "Accept:application/json" -H "Content-Type:application/json" --data '{ "name":"oVirt", "type":"prometheus", "url":"http://prometheus:9090", "access":"proxy", "basicAuth":false }' http://admin:admin@localhost:3000/api/datasourcesWhen visiting http://localhost:9090/status you should see that Prometheus picked up the hosts:
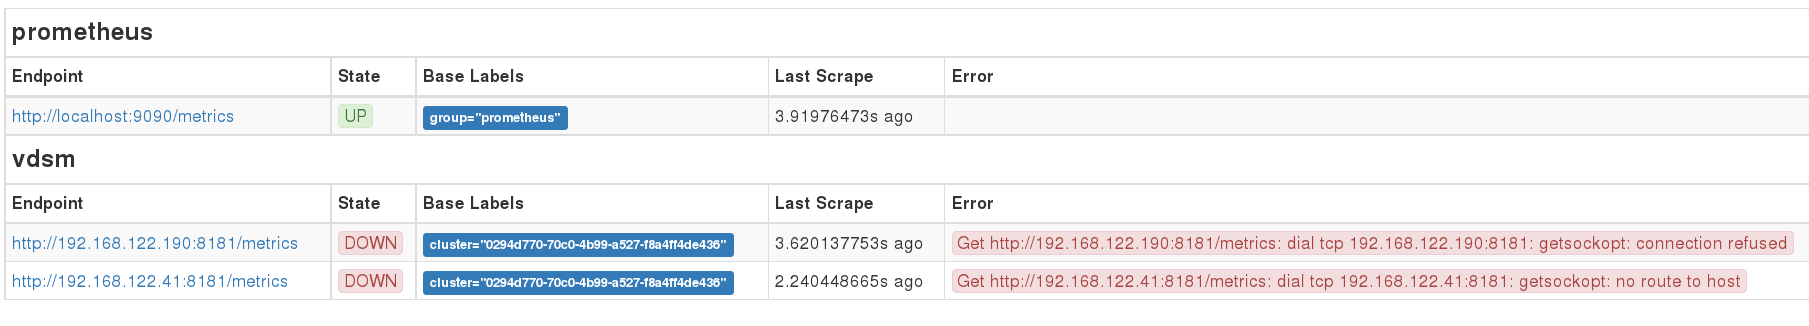
There are no metrics for Prometheus to collect for now. Let’s change that
by installing vdsm-prometheus on the hosts.
Install vdsm-prometheus on all hosts
With Ansible and the right role from Ansible Galaxy it is easy to install vdsm-prometheus on all hosts.
First create an Ansible inventory by querying oVirt Engine for all existing hosts:
export ENGINE_HOST=http://localhost:8080
export ENGINE_PASSWORD=engine
echo "[vdsm]" > hosts && \
    curl -H "Accept:application/json" -H "Content-type:application/json" -X GET --user admin@internal:$ENGINE_PASSWORD $ENGINE_HOST/ovirt-engine/api/hosts \
    | jq '.host[].address' -r >> hosts
In my case this produces an Ansible repository with two hosts:
[vdsm]
192.168.122.190
192.168.122.41
Fetch the Ansible role which will install vdsm-prometheus on every host:
ansible-galaxy install rmohr.vdsm-prometheusStore this Ansible playbook in vdsm-prometheus.yml:
---
- hosts: vdsm
  roles:
    - { role: rmohr.vdsm-prometheus, opts: "-no-verify -no-prom-auth -vm-scrape-interval=10" }
Execute the playbook:
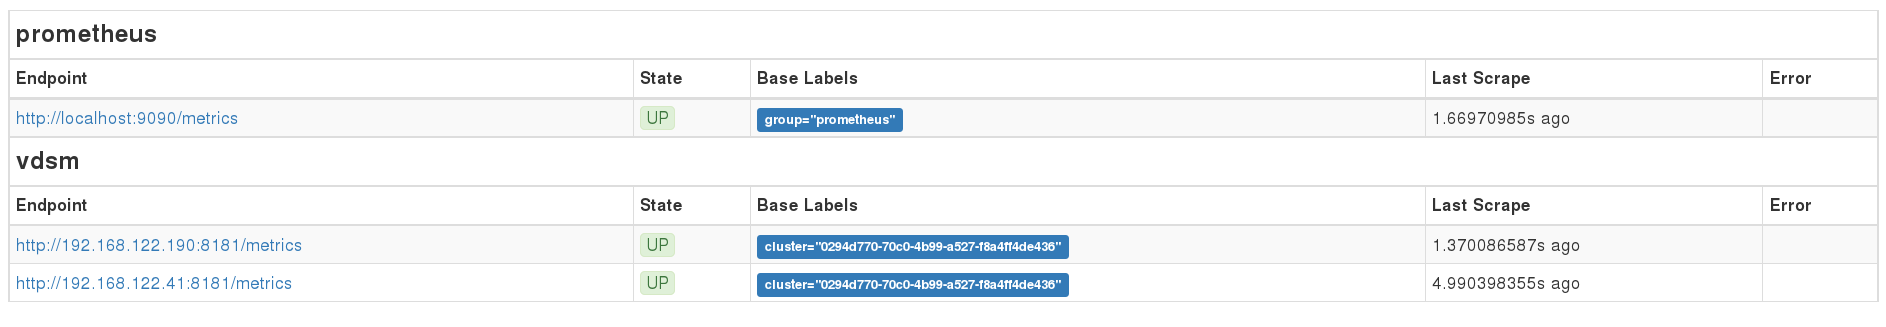
ansible-playbook -i hosts -u root --private-key $ENGINE_HOME/etc/pki/ovirt-engine/keys/engine_id_rsa vdsm-prometheus.ymlWhen visiting http://localhost:9090/status
again you should see that the state of the Prometheus targets is now UP:
Querying Prometheus with Grafana
Finally you can visit http://localhost:3000 and log
into Grafana with the default credentials admin:admin. Here you can see a
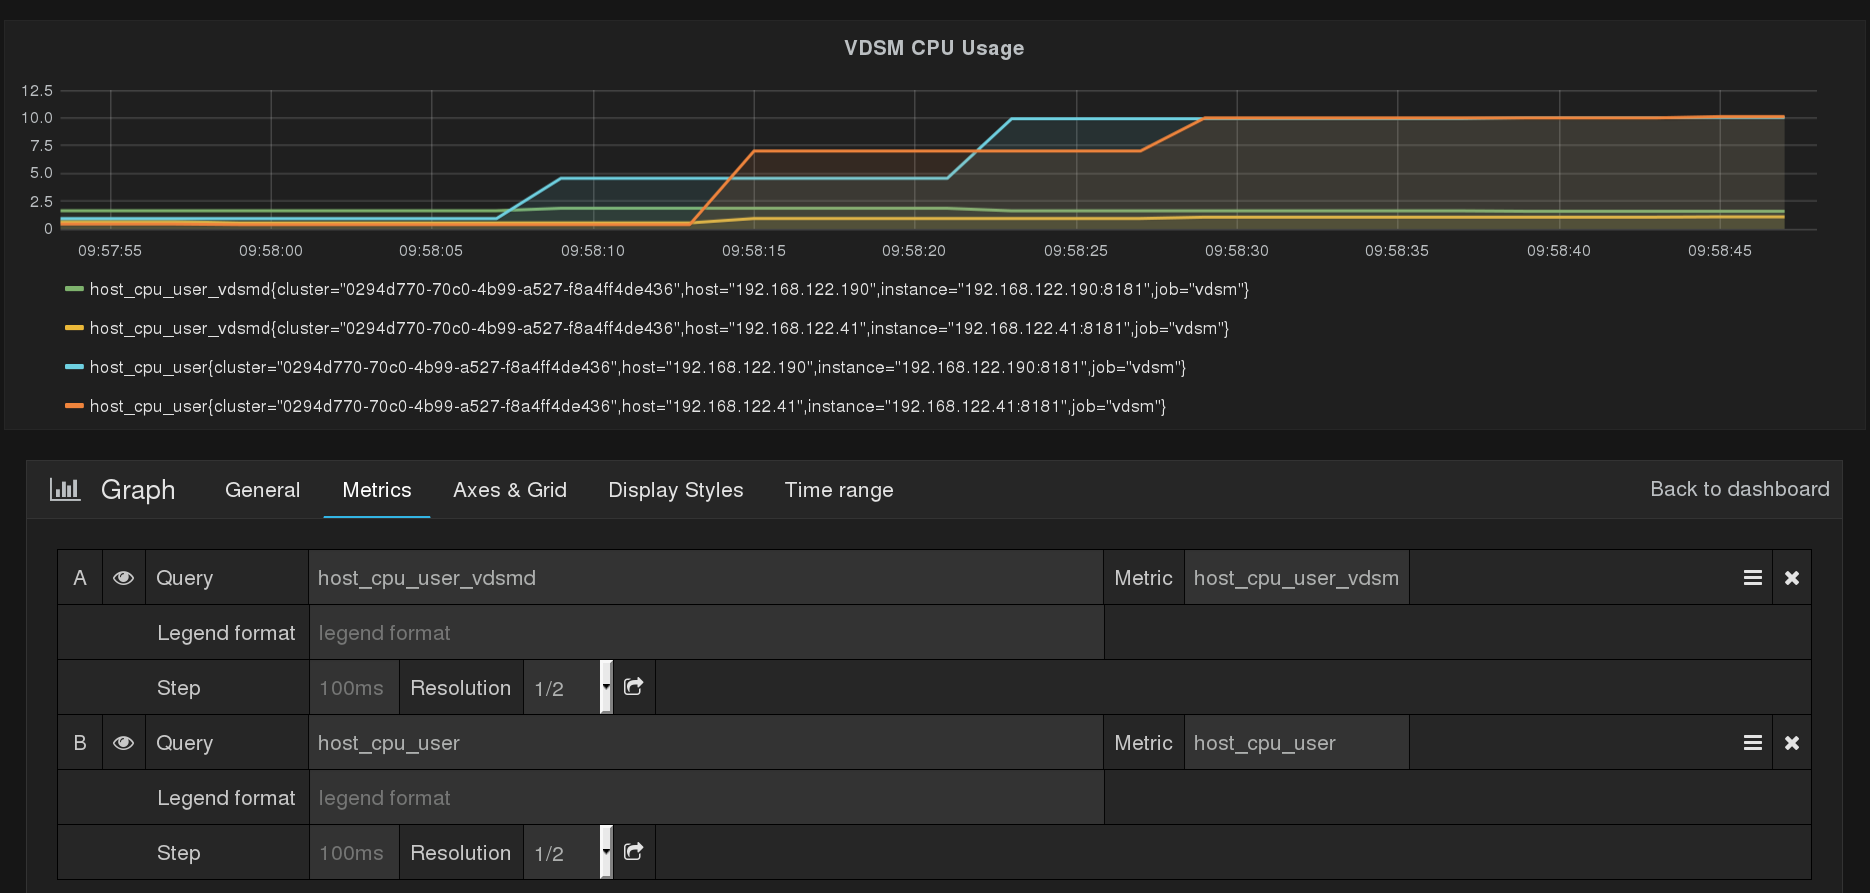
very simple case where I am monitoring the CPU usage of VDSM itself:
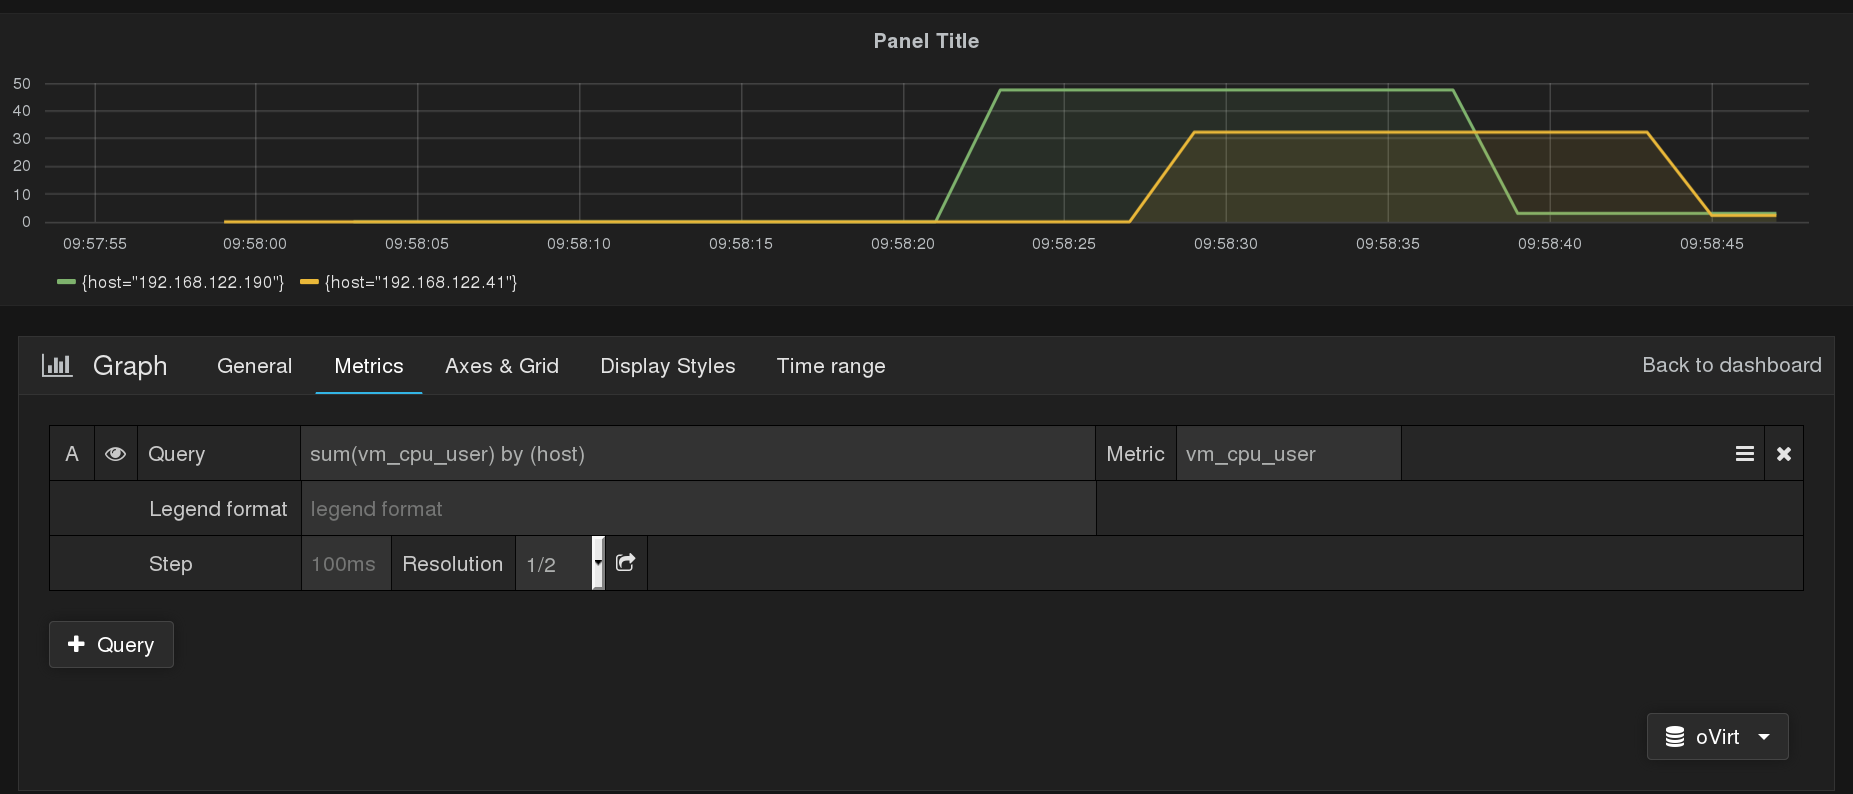
Here is another case where we are displaying the sum of the CPU usage of all VMs per host with the function sum(vm_cpu_user) by (host):